
Direct path blocked
The science
of UV-C.
It starts with
the wavelength.
- UV-C · 100–280 nmThe highest energy in the spectrum, and the most effective at inactivating microorganisms. It damages nucleic acids directly, stopping replication.
- UV-B · 280–315 nmMore energy than UV-A. Involved in vitamin D and melanin production; damages cells in the upper skin layers.
- UV-A · 315–400 nmThe longest wavelengths, and the lowest energy. Reaches deeper skin layers and contributes to long-term photoaging.
Why 254 nm, when the peak germicidal response is 260–270 nm?
The wavelength comes from the lamp. A low-pressure mercury lamp emits almost all of its ultraviolet output on a single line at 254 nm — the resonance line of mercury itself, rather than a figure chosen by design. It is what a mature, high-output UV-C source produces.
Response at 254 nm sits close to the 260–270 nm peak, but below it.[8] Sources that emit inside the peak do exist, principally UV-C LEDs, but their radiant output per device is substantially lower. Dose is irradiance multiplied by time,[4] so a weaker source has to hold each position proportionally longer to deliver the same dose. That is what makes the peak impractical at room scale: the A1 works at the higher-output wavelength and accumulates dose through position and duration instead.
The band colors above distinguish those regions; they do not show visible light or germicidal effectiveness. The marked span is the commonly cited peak of the germicidal response, not a measure of it.
Each photon at 254 nm carries 4.88 eV, calculated from E = hc/λ.[2]
UV-C is the standard for disinfection.
Ultraviolet light sits just beyond the violet end of the visible spectrum, from about 100 to 400 nanometers. It is invisible to the eye, and divides into three bands by wavelength and energy.[1]
Only UV-C carries enough energy to permanently damage microbial genetic material directly, making it the industry standard for UV disinfection. By contrast, broad-spectrum devices split their output across all three bands, so only part reaches the germicidal range; the A1’s lamps operate at a dedicated 254 nm UV-C wavelength within it.
Explore the A1UV-C damages
microbial DNA/RNA.
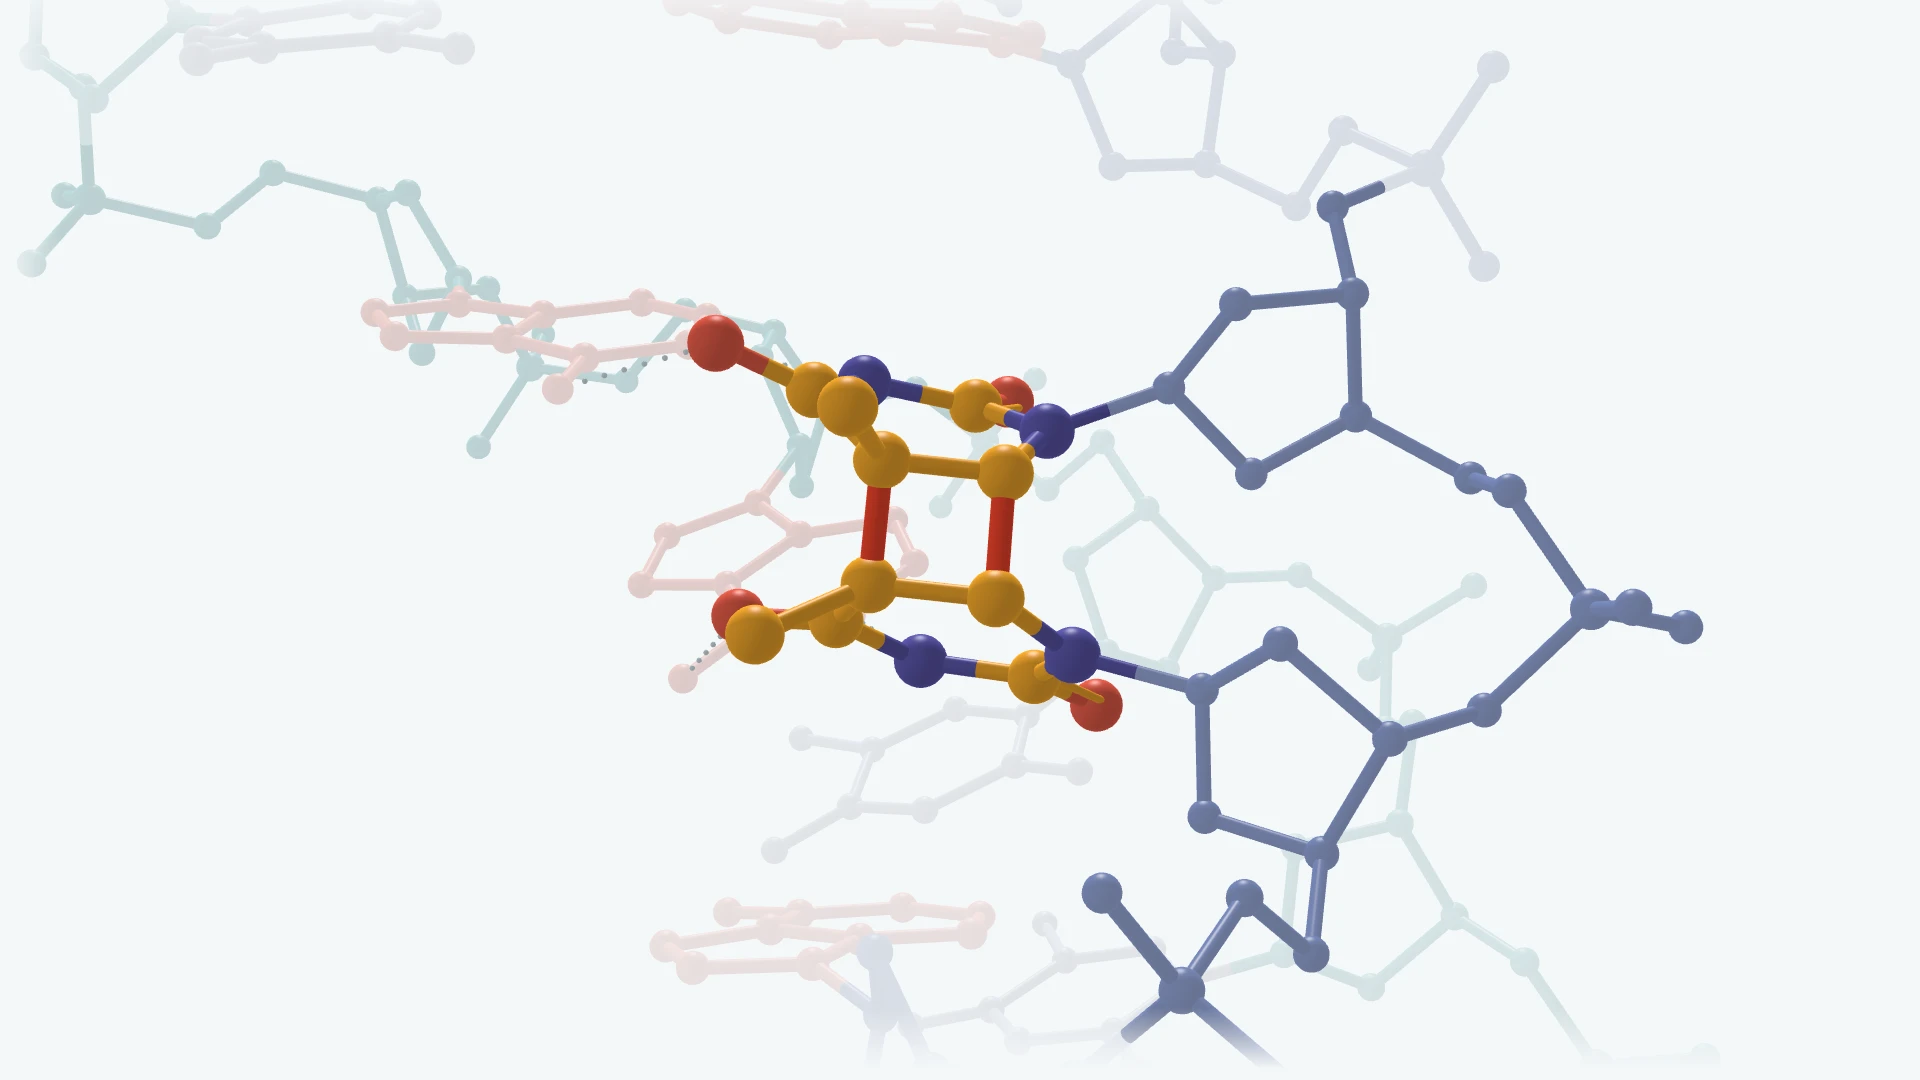
In the reaction shown, absorbed UV-C drives the formation of two new covalent bonds between neighboring thymine bases on the same DNA strand, forming a cyclobutane pyrimidine dimer. This lesion disrupts normal DNA replication. The animation follows the same bases from intact DNA to the dimer.
Based on experimental DNA structures. Motion, colors, and UV-C depiction are illustrative. Before exposure · Thymine dimer
Lesions that disrupt replication.
Absorbed UV-C causes photochemical damage to nucleic acids. In DNA, this damage includes cyclobutane pyrimidine dimers: lesions that link neighboring pyrimidine bases on the same strand.[3]
These lesions disrupt normal DNA replication. The response depends on the organism, wavelength, exposure, and conditions.[4]
Cumulative UV-C dosage
results in disinfection.
See how dose builds with exposure.
Target microorganism: S. aureus (MRSA)
Dose received
mJ/cm²
Energy received per unit area
Log reduction measured
No tested dose reached yet
What does “log reduction” mean?
Each additional log means ten times fewer surviving microorganisms.
| Log reduction | Percent reduction |
|---|---|
| 1 log | 90% |
| 3 log | 99.9% |
| 5 log | 99.999% |
Source: Cadnum JL et al. (2021), UV-C monitoring made simple, Figure 4A. MRSA dried on stainless steel; values are approximate means read from the figure.[9]
Different doses, different reductions.
UV-C dose is the total UV-C energy a surface receives per unit area.[4] Dose is invisible and builds up gradually, much like filling a glass with water. The water level is the dose the surface has received so far.
The marks show the log reductions one study measured at each tested dose (in mJ/cm²).[9]
Intensity sets the pace.
Raise the UV-C intensity and the glass fills faster, but the marks stay where they are. The dose needed stays the same; what changes is how quickly it is reached.
The target sets the dose.
The target microorganism and the desired log reduction determine the UV-C dose a surface needs. Testing and dosimeters confirm that dose-response relationship.[9]
The limitations of UV-C.
Understand the roles of distance and shadowing.
Drag the light source to change its distance from the target and its line of sight. Drag the object to change what it blocks.
Distance and shadows are two limitations of UV-C light. Intensity falls off sharply with distance — doubling the distance from a surface drops the dose to a quarter, following the inverse-square law.[5] And anything blocking a direct line of sight between the light source and a surface casts a shadow there, no matter how close the light source is.[6]
Put this knowledge into practice.The A1 addresses
both limitations directly.
The A1’s sensor suite builds a map of the room and plans a route to each disinfection point, navigating around objects and getting within close proximity to surfaces to maximize exposure at each area.
Because the A1 moves through the space rather than treating it from a single fixed position, it can overcome the limitations of UV-C light with efficiency and precision, treating areas a stationary device may find challenging and time-consuming to reach.
Learn more about the A1’s sensor suite and technologyReferences
Research and technical references for UV-C wavelength, microbial response, and surface exposure.
References
Research and technical references for UV-C wavelength, microbial response, and surface exposure.
- 01 / SPECTRUMWorld Health Organization — Ultraviolet radiation ↗
UV band boundaries and atmospheric absorption.
- 02 / PHOTON ENERGYNIST — Mass and Planck’s constant ↗
Planck’s relation; the energy display uses E = hc/λ.
- 03 / PHOTOCHEMISTRYKim, Jin & Pfeifer (2013) — Formation of cyclobutane pyrimidine dimers ↗
Primary research on UV-induced lesions at adjacent DNA bases.
- 04 / EXPOSUREInternational Ultraviolet Association — UV FAQs ↗
Irradiance, exposure time, UV dose, and biological response.
- 05 / SOURCE GEOMETRYU.S. Department of Energy / PNNL — Radiometric testing of UV-C products ↗
Measurement geometry and the limits of inverse-square calculations near extended sources.
- 06 / SURFACE CONDITIONSInternational Ultraviolet Association — Surface and air UV guidance ↗
Line of sight, surface texture, and operating precautions.
- 07 / GERMICIDAL RANGEU.S. EPA — Ultraviolet Disinfection Guidance Manual, §2.2.1 ↗
200–300 nm as a commonly used germicidal range; reference to the spectrum convention in a water-treatment manual.
- 08 / PEAK RESPONSEBeck et al. — Measured germicidal action spectra ↗
Relative peak sensitivity at 260–270 nm among the tested bacteria and viruses above 240 nm, with organism-dependent responses at shorter wavelengths.
- 09 / DOSE & RESPONSECadnum JL et al. (2021) — UV-C monitoring made simple, Figure 4A ↗
MRSA USA800 dried on stainless-steel carriers, without added organic soil. Approximate mean reductions read from Figure 4A. DOI: 10.1017/ice.2021.113.